We tested our zones against 7 years of real data. Here's what actually happened.
Support and resistance zones, generated by a mathematical model — every touch validated against historical reality across four futures markets.
5,617 documented reactions. Every zone. Every outcome. Every lesson.
Validated means tested, not guaranteed: zones held 61.3% of the time and broke 39% of the time — and we show you every one. Zones are backed by verified historical behavior, not opinion.
You think you know how price behaves at key levels. But without the record, you're only remembering the zones that worked.
Most traders carry a mental highlight reel — the clean bounces, the painful breaks, a few "I knew it" moments. What's missing is the full record. The zones that almost held. The ones that quietly broke. The patterns that look obvious in hindsight but blended into noise in real time. This library is that full record. 5,617 touches. Every reaction. Every break. Studyable, filterable, learnable.
What you'll be able to do
The library isn't theory. It's pattern recognition fuel.
Study thousands of validated touches and train your eye to spot the conditions that precede a clean reaction.
Every break is documented in full, so you stop expecting bounces that won't come.
See how ES, NQ, GC, and CL each react at their zones — on the 5-minute and the 1-hour.
See whether a level has historically held or broken, how often, and how far reactions ran — context for your own decision, not a signal.
How the library teaches you to read these zones.
It doesn't tell you "enter here, exit there." It does something better — it shows you 5,617 validated reactions and lets you build your own pattern recognition.
By the time you've studied a few hundred touches, you'll see things you didn't before:
You'll spot them in live charts before they happen — not after.
Every broken zone is documented. You'll learn the warning signs.
Zone freshness matters statistically — the data shows how.
Measured in points and R-multiples across thousands of touches.
No rigid rules. No black box. No "follow these signals." Just pattern recognition built from 5,617 validated reactions — the way professional traders learn.
Built for how you actually trade.
- How S/R zones behave on first touch vs second vs third
- Which intraday hours produce the cleanest reactions
- How volume confirms or invalidates a zone reaction in real time
- Why some zones break instantly while others hold for hours
- When to wait, when to act, when to skip.
You'll come away knowing which intraday zones are worth waiting for, and which are statistical noise.
- First-touch reactions that signal a multi-day reversal
- Zone freshness — why the 1st test differs from the 5th
- Failure patterns — what a break looks like before it confirms
- Reaction-size data — how far holds run in points/R
- Which zones deserve overnight commitment.
You'll come away knowing which zones are worth holding through, and how reactions typically extend.
- Which major zones held for weeks vs got blown through
- Annual breakdowns — how the same zone types behaved in trending vs ranging years
- How each of the four markets differs structurally
- Calibration — how reliable the hold probabilities have been.
You'll come away understanding which structural levels carry weight across regimes.
- 5,617 worked examples of zone reaction and outcome
- Side-by-side comparisons of clean holds vs near-miss breaks
- How calibration is measured and why it matters
- How the model generates zones, transparently explained.
You'll come away understanding the method, not just the results.
The edge is real — and you can verify it.
Anyone can show a green track record. The real question: is this edge real, or is it luck? Here's the evidence.
| Year | ES | NQ | GC | CL |
|---|---|---|---|---|
| 2019 | 65.8% | 59.3% | 69.7% | — |
| 2020 | 72.8% | 58.3% | 61.8% | — |
| 2021 | 70.9% | 57.7% | 57.7% | 59.8% |
| 2022 | 59.2% | 61.9% | 63.6% | 58.7% |
| 2023 | 60.5% | 58.7% | 56.8% | 59.6% |
| 2024 | 62.2% | 54.8% | 62.4% | 59.5% |
| 2025 | 67.2% | 64.7% | 66.4% | 60.6% |
| 2026 | 66.4% | 58.9% | 68.2% | 62.7% |
| All | 65.0% | 60.9% | 62.8% | 60.3% |
Every cell is the share of zone touches that held that year. NQ 2024 (54.8%) is shown honestly — we don't trim the down years.
Calibration is the honest test: not whether the model is bullish or bearish, but whether its stated probabilities match what actually happens. ±1.52% means the probabilities you see on every zone are trustworthy as probabilities — not as guarantees.
Three touches. Three different reactions. All from the actual library.
Click any chart to enlarge. These are the same charts you'll study in the full library.
How the library is built.
- Mathematical zone generation (MOD1, ATR-based)
- 7 years across 4 markets (ES, NQ, GC, CL)
- Every touch logged on the 5-minute and 1-hour
- No cherry-picking — every zone included.
- Curve-fit zones to past data
- Hide breaks or unfavorable periods
- Promise live trading profits
- Sell signals — this is a study and education tool.
- The full validated reaction record
- Filterable charts by market, year, zone type
- Calibration fully disclosed
- Every zone, held or broken.
To be clear, this library is NOT for:
- Traders who want a black-box system that trades for them
- Anyone who needs a guaranteed bounce to feel confident
- People unwilling to study charts and patterns
- Anyone expecting predictions instead of probabilities.
If any of those apply, this isn't the right product. We'd rather you not buy than be disappointed.
Inside the Reaction Library
Hold rate is the system's actual track record across historical touches — not a model projection.
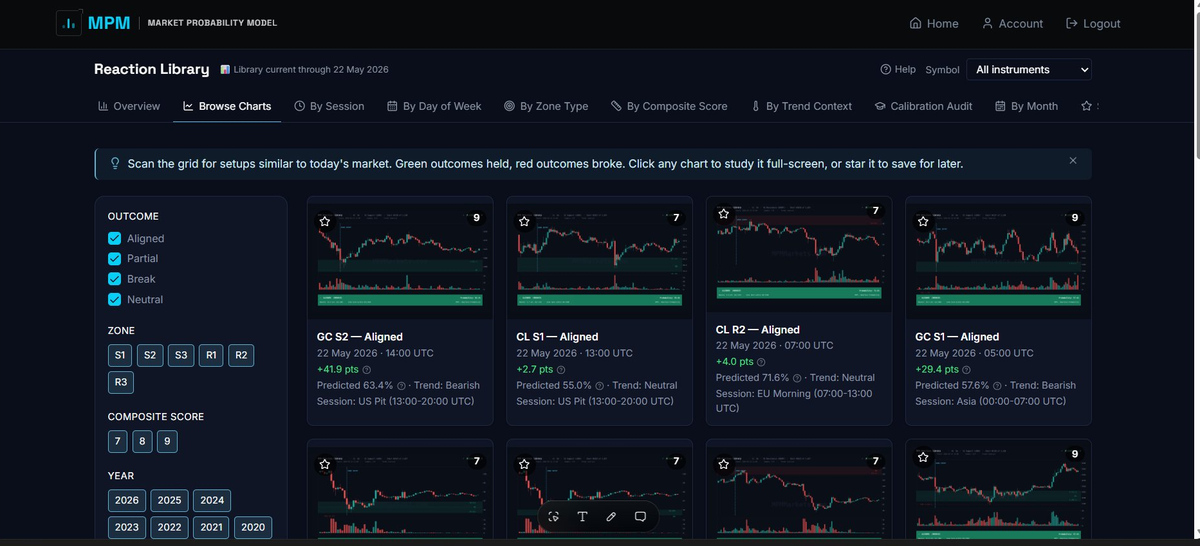
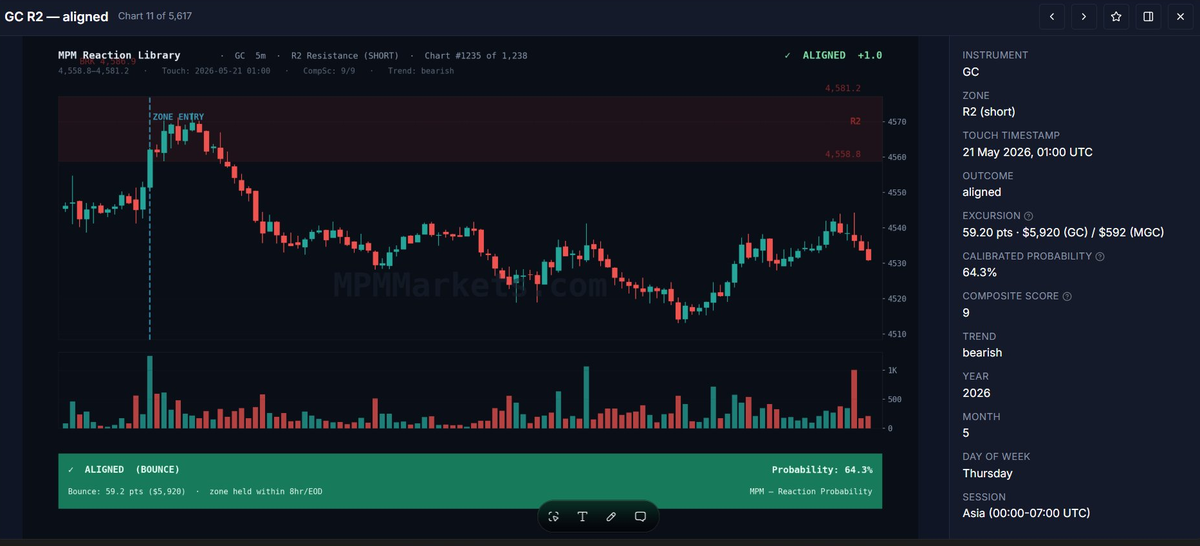
A measured documentary of how price reacted at our zones — every outcome, win or lose.
Questions, honestly answered.
5,617 reactions are waiting.
Open the library and start building your own pattern recognition.
What happened at the zone
See how price has behaved at MPM zones across thousands of touches — which conditions have tended to hold price, and which let it through. This is the observation layer: the reaction itself, studied across years of data.
- Thousands of documented zone touches across core markets
- Full chart library with filters
- Calibration and hold-rate data
- Everything in the Reaction Library
- Daily MPM Alerts briefs
- Start studying with live structure in hand
one-time · 3-month access
- Everything in the 3-month plan
- Lifetime access — yours to keep
- How price reacts at each level — the reaction, measured